iCSC Cloud & Containers - Exercises
===
In this exercise session we will learn how to apply the concepts we have heard about in the lecture.
We will build and deploy an existing application with containers and Kubernetes.
Just like Linux, several Kubernetes "distributions" exist that provide a more complete experience compared to "vanilla Kubernetes".
They add features such as multi-tenancy and monitoring, as well as enhance the default security and monitoring.
For this session we'll be using the open-source [OKD](https://www.okd.io/), which is based on the same code as RedHat's OpenShift.
Other [examples of Kubernetes distributions](https://www.containiq.com/post/popular-kubernetes-distributions) include Rancher's RKE and k3s, VMWare Tanzu, GCP's GKE, AWS EKS and Azure AKS.
At the core, all distributions are Kubernetes and use the same API.
This means that your skills as well as the application you will develop in this session can be easily ported between any of these distributions.
*All following commands will be run from LXPLUS9:* `ssh <USERNAME>@lxplus9.cern.ch`
*Create a new folder for the exercises:* `mkdir icsc-clouds && cd icsc-clouds`
<!-- \pagebreak -->
## 1. Building and deploying an application
### Get application source code
We'll be using a ["RealWorld" demo application](https://www.realworld.how/) written in Python for this session:
<https://github.com/danjac/realworld>
Let's get started by downloading the application source code:
```sh
wget https://github.com/danjac/realworld/archive/refs/heads/main.zip
unzip main.zip
rm main.zip
```
You should now have a directory called `realworld-main`.
### Build a container image
To build a container image, we need to write a [Dockerfile](https://docs.docker.com/engine/reference/builder/).
This file contains a series of instructions for building the image.
Each instruction creates a new layer and at the end all layers are overlayed to produce the final "view" of the filesystem.
By convention, this file is named `Dockerfile` and stored in the root project directory.
Create a new, empty file by typing `nano Dockerfile`.
* Which base image should be used for the image?
<details>
<summary>Click here to see the solution</summary>
We will use the latest stable release of Python: 3.11.
Python has an [official container image available on DockerHub](https://hub.docker.com/_/python), which we'll use for our applications.
Official images have trustworthy content and receive timely security fixes.
`FROM docker.io/library/python:3.11`
</details>
---
* How do we install the application in the image?
<details>
<summary>Click here to see the solution</summary>
Python applications don't need much installation, therefore we just need to add the source code and download the dependencies.
```sh
COPY ./realworld-main /app
RUN pip3 install -r /app/requirements.txt
```
</details>
---
* What is the correct way to [run the Django application](https://docs.djangoproject.com/en/4.1/ref/django-admin/)? (assuming that we first need to apply database migrations and then start the server on port 8080)
<details>
<summary>Click here to see the solution</summary>
In principal, Django applications only need `./manage.py runserver`.
However, we also need to make sure that the database migrations are applied before starting the server and that the servers listens for external connections (not only localhost).
```
CMD ["/bin/sh", "-cx", "/app/manage.py migrate && exec /app/manage.py runserver 0.0.0.0:8080"]
```
</details>
---
* Next, build the image locally.
<details>
<summary>Click here to see the solution</summary>
Docker users can use:
```
docker image build -t realworld .
```
Podman users should use the equivalent:
```
podman image build -t realworld .
```
</details>
---
* Finally, try [running the container locally](https://docs.podman.io/en/latest/markdown/podman-run.1.html) and expose it on a random port (between 1000 and 10000).
<details>
<summary>Click here to see the solution</summary>
```
docker/podman container run --rm -p 1234:8080 realworld
```
*The first port (1234) refers to the external port, the second port (8080) is the port inside the container to which we are forwarding traffic.*
</details>
---
Use `curl -v localhost:1234` to check the server is running.
---
To learn more about the structure of the container image we have just built, we can use a tool called `dive`: <https://github.com/wagoodman/dive>
Install the tool like this:
```
wget https://github.com/wagoodman/dive/releases/download/v0.10.0/dive_0.10.0_linux_amd64.tar.gz
wget https://github.com/wagoodman/dive/releases/download/v0.10.0/dive_0.10.0_checksums.txt
sha256sum --check --ignore-missing dive_0.10.0_checksums.txt
# sha256sum should print "OK"!
tar xf dive_0.10.0_linux_amd64.tar.gz
mkdir ~/.config/dive && echo 'source: podman' > ~/.config/dive/dive.yaml
```
Now inspect the content of the image by running `./dive realworld --source podman`
Use the arrow keys to navigate within the current view, press TAB to switch the view (left/right), Ctrl-C to exit.
* How many layers does the image have?
* Can you identify which files were added in each layer?
### Build image automatically
Building the container image is useful for a quick feedback loop, but we should automate this process so that any code change automatically triggers a new build.
This also helps to make the build artifact more reproducible.
Add the following snippet as the `.gitlab-ci.yml` file (in the root of the project directory, next to the `Dockerfile`):
```yml
stages:
- build
- deploy
'Build container image':
stage: build
image:
name: gitlab-registry.cern.ch/ci-tools/docker-image-builder
entrypoint: [""]
script:
# Prepare Kaniko configuration file, `CI_*` variables come from Gitlab CI
- echo "{\"auths\":{\"$CI_REGISTRY\":{\"username\":\"$CI_REGISTRY_USER\",\"PASSWORD\":\"$CI_REGISTRY_PASSWORD\"}}}" > /kaniko/.docker/config.json
- /kaniko/executor --context $CI_PROJECT_DIR --dockerfile $CI_PROJECT_DIR/Dockerfile --destination ${CI_REGISTRY_IMAGE}:latest
```
Create a new Git repository and commit everything: `git init && git add -f . && git commit -m "Initial commit"`
[Create a new (blank) GitLab project](https://gitlab.cern.ch/projects/new) (mark it as *public* and *do not* initialize it with a README) and push the local repository there (follow instructions in the Gitlab web interface for "Push an existing Git repository").
You can follow the build process in the "Pipelines" section on Gitlab (`https://gitlab.cern.ch/<USERNAME>/<PROJECTNAME>/-/pipelines`).
After successful built, you can see the image here: `https://gitlab.cern.ch/<USERNAME>/<PROJECTNAME>/container_registry`
### Deploy on Kubernetes
The cool aspect about containers is that they *contain* everything necessary to run the application, which means we can run the container anywhere: on a laptop, on a VM, on LXPLUS etc.
But in those cases we don't benefit from the advanced features a *container orchestrator* (such as Kubernetes) offers us: automatic health checks and self healing, seamless scaling across multiple nodes and other platform integrations.
We'll be using CERN's Platform-as-a-Service which is based on OpenShift.
OpenShift comes with the `oc` command-line client which has the same features as the regular `kubectl` Kubernetes command-line client, plus a few additional extensions.
For most of the commands we will run below, `oc` and `kubectl` can be used interchangeably.
* Connect to the OKD cluster with the CLI: `oc sso-login paas-stg`
* Create a new project: `oc new-project "icsc-<USERNAME>" --description "Test project for iCSC 2023"`
* [Create a new deployment](https://kubernetes.io/docs/tutorials/kubernetes-basics/deploy-app/deploy-intro/) named "real-world" using the container image we have just built with Gitlab CI:
<details>
<summary>Click here to see the solution</summary>
```
oc create deployment real-world --image=gitlab-registry.cern.ch/<USERNAME>/<PROJECTNAME>
oc get deployment real-world -o yaml
```
*Note: you can see a preview of the resource(s) that will be created by appending `-o yaml --dry-run=client` to the command.*
</details>
---
Observe what's happening with `oc get pods -w` and `oc describe pod/<pod-name>`.
Are the pods running?
Check the log output with `oc logs pod/<pod-name>`.
<details>
<summary>Click here to see the solution</summary>
The pod is crashing / in state `CrashLoopBackOff` because the application exits with an error code (return code != 0).
By inspecting the logs we can conclude that it is failing because of the hardcoded database location (which is not writeable).
Let's make it configurable in the application: in `realworld-main/realworld/settings.py`:
* at the top of the file add `import os`
* adjust the following section:
```diff
DATABASES = {
"default": {
"ENGINE": "django.db.backends.sqlite3",
- "NAME": BASE_DIR / "db.sqlite3",
+ "NAME": os.getenv("DB_PATH", os.path.join(BASE_DIR, "db.sqlite3")),
}
}
```
* change `ALLOWED_HOSTS = []` to `ALLOWED_HOSTS = ["*"]` (we'll need this to remotely access the application later)
Then, add `ENV DB_PATH=/data/db.sqlite3` to your `Dockerfile` *before* the `CMD` line.
</details>
---
Commit and push everything (`git add Dockerfile realworld-main/ && git commit -m "Make DB path configurable" && git push`), wait for the new image to be built and then [add a volume (PersistentVolumeClaim, PVC) to the Deployment](https://docs.openshift.com/container-platform/4.11/nodes/containers/nodes-containers-volumes.html).
<details>
<summary>Click here to see the solution</summary>
```
oc set volume deployment/real-world --add --name=data --mount-path=/data -t pvc --claim-size=1Gi --claim-mode=ReadWriteMany
oc get deployment/real-world -o yaml
```
</details>
---
Is the pod running now? Do the logs look fine? What is the IP of the pod?
<details>
<summary>Click here to see the solution</summary>
```
oc get pod -o wide
oc get pod/<NAME> -o yaml
oc logs pod/<NAME>
```
</details>
### Expose the application
[Create a cluster-internal service](https://kubernetes.io/docs/tutorials/services/connect-applications-service/) that forwards traffic to the pods of the deployment.
<details>
<summary>Click here to see the solution</summary>
```
oc create service clusterip real-world --tcp=8080:8080
oc get service real-world -o yaml
oc get endpoints
```
</details>
How does the service know to which pods it should connect?
It uses labels the identify the pods: https://kubernetes.io/docs/tutorials/kubernetes-basics/expose/expose-intro/
Use the [port forwarding feature](https://kubernetes.io/docs/tasks/access-application-cluster/port-forward-access-application-cluster/) to access the application on port 8080:
<details>
<summary>Click here to see the solution</summary>
```sh
# use a random port to avoid allocation conflicts!
oc port-forward service/real-world 5678:8080 &
curl -s -v http://localhost:5678
> HTTP/1.1 200 OK
```
</details>
### Create an Ingress
To access the application easily from outside the cluster, we need to [create an Ingress resource](https://kubernetes.io/docs/concepts/services-networking/ingress/).
Use `icsc-<USERNAME>.webtest.cern.ch` as the hostname.
<details>
<summary>Click here to see the solution</summary>
```
oc create ingress real-world --rule=<HOSTNAME>/*=real-world:8080
oc get ingress -o yaml
```
</details>
<!-- \pagebreak -->
## 2. Creating and installing a Helm chart
### Let's put everything in a Helm chart
[Helm](https://helm.sh/) is a package manager for Kubernetes applications.
Each [Helm chart](https://helm.sh/docs/topics/charts/) contains a collection of manifests that describe how the application should be deployed (`Deployments`, `Services`, `ConfigMaps` etc.).
The user can provide [configuration parameters in the `values.yaml`](https://helm.sh/docs/chart_template_guide/values_files/) file to define key aspects of the application (ingress hostname, number of deployment replicas etc.).
Read through [Helm's Getting Started guide](https://helm.sh/docs/chart_template_guide/getting_started/) to familiarize yourself with the concepts.
Now, it's time to create our first Helm chart.
The process is a bit tedious, but it will familiarize us with the basic principals of Helm charts: how they are templated and organized.
```sh
# in the root directory of your project
helm create real-world
rm -rf real-world/templates/*
```
* Create the template for the `Deployment`:
* `oc get deployment real-world -o yaml > real-world/templates/deployment.yaml`
* Open the file `real-world/templates/deployment.yaml` and edit is as follows
* In the `metadata` section:
* remove all fields *except* `name`
* replace `name: real-world` with `name: {{ .Release.Name }}`
* In the `spec` section:
* replace all occurrences of `app: real-world` with `app: {{ .Release.Name }}`
* replace `claimName: pvc-xxxx` with `claimName: {{ .Release.Name }}-data`
* replace `image: gitlab-registry.cern.ch/...` with `image: {{ .Values.server.image }}`
* Remove the entire `status` section
* Create the template for the `Service`:
* `oc get service real-world -o yaml > real-world/templates/service.yaml`
* Open the file `real-world/templates/service.yaml` and edit is as follows
* In the `metadata` section:
* remove all fields *except* `name`
* replace `name: real-world` with `name: {{ .Release.Name }}`
* In the `spec` section:
* Remove the prefilled `clusterIP` and `clusterIPs` fields
* Replace `app: real-world` with `app: {{ .Release.Name }}`
* Remove the entire `status` section
* Create the template for the `PVC`:
* `oc get pvc <PVC-NAME> -o yaml > real-world/templates/pvc.yaml`
* Open the file `real-world/templates/pvc.yaml` and edit is as follows
* In the `metadata` section:
* remove all fields *except* `name`
* replace `name: pvc-xxxx` with `name: {{ .Release.Name }}-data`
* In the `spec` section:
* remove the prefilled `volumeName` field
* Remove the entire `status` section
* Create the template for the `Ingress`:
* `oc get ingress real-world -o yaml > real-world/templates/ingress.yaml`
* Open the file `real-world/templates/ingress.yaml` and edit is as follows
* In the `metadata` section:
* remove all fields *except* `name`
* replace `name: real-world` with `name: {{ .Release.Name }}`
* In the `spec` section:
* replace the hardcoded `host: example.webtest.cern.ch` with a template: `host: {{ .Values.ingress.host }}`
* replace the `service` > `name: real-world` with `name: {{ .Release.Name }}`
* Remove the entire `status` section
Take a look at the sample `values.yaml` file in the `real-world` directory to familiarize yourself with the structure.
Helm charts can become very complex depending on the application they deploy and how many configuration parameters are available.
Our simple application just needs a handful of "values", therefore we can relace the content of the entire `values.yaml` file with
```yaml
server:
image: gitlab-registry.cern.ch/<USERNAME>/<PROJECTNAME>:latest
ingress:
host: ""
```
Let's check if we made any typos in the process. The following command will check that there aren't any (syntactic) errors in the final YAML resources.
```sh
helm template real-world ./real-world | oc apply -f - --dry-run=client
```
### Deploy the Helm chart
We're almost ready to deploy our first Helm chart.
We just need to cleanup the resources we created previously.
You can list the resources with: `oc get ingress,service,deployment,pvc`.
Delete them with the appropriate command.
<details>
<summary>Click here to see the solution</summary>
```
oc delete ingress/real-world service/real-world deployment/real-world pvc/<PVC-NAME>
```
</details>
---
Now we can *install* our Helm chart. This means creating a new, named instance of the chart -- a so called *Helm release*.
Note that we are still using `icsc-<USERNAME>.webtest.cern.ch` as the hostname.
```sh
# real-world is the name of our Helm release
# ./real-world is the directory of the chart
# Helm values can not only be set in `values.yaml`, but also on the command-line with `--set`
helm install real-world --set ingress.host=<HOSTNAME> ./real-world
```
Have all resources been created correctly?
Is the application pod running?
Visit `https://<HOSTNAME>` to see if the website is online.
*I am getting Error: INSTALLATION FAILED: deployments.apps "real-world" already exists*
-> Helm does not overwrite existing resources. Follow the instruction at the beginning of the "Deploy the Helm chart" section to clean up the old resources.
### Fill the website with some sample data
To give the website some live, we will fill it with sample data.
Download the following script and execute it by providing the HTTP URL of your website.
Afterwards, check that the content has been successfully published on the website.
<details>
<summary>Click here to see the solution</summary>
```
curl -sL -o fake.sh https://gitlab.cern.ch/-/snippets/2510/raw/master/fake.sh?inline=false
bash ./fake.sh https://<HOSTNAME>
```
</details>
### Summary (so far)
Congratulations! You have successfully built a container image for the application and deployed the application on Kubernetes!
You applied the best practices for declarative infrastructure as code and made yourself familiar with industry-standard tools such as `kubectl`, `oc` and `helm`.
If time permits (or you are curious later on), you may continue with the following, optional sections in which you will learn how to monitor and (auto-) scale a cloud-native application.
<!-- \pagebreak -->
## 3. Monitoring the application
### Let's add a metrics endpoint to our application
Adding a metrics endpoints gives us insight into what our application is doing:
* number of served HTTP requests (successful/failed)
* runtime details
* status of database migrations
* ...
We'll use the `django-prometheus` Python module to add a Prometheus metrics endpoint to our "real world" application.
Add the following in `realworld-main/requirements.txt`:
```
django-prometheus==2.2.0
```
Then follow the Quickstart guide for modifying the Python code: https://pypi.org/project/django-prometheus/
Commit the changes to the Git repository, push the changes to GitLab and wait for the new image to be built.
Run the container locally (as before) and check if you can reach the metrics endpoint (`/metrics`).
Inspect the reported metrics and their format.
<details>
<summary>Click here to see the solution</summary>
```
docker image pull gitlab-registry.cern.ch/<USERNAME>/<PROJECTNAME>:latest
docker container run --rm -p 8080:8080 gitlab-registry.cern.ch/<USERNAME>/<PROJECTNAME>:latest
curl -i http://localhost:8080/metrics
```
</details>
### Create a ServiceMonitor (in the Helm chart)
Clearly, looking at these bare metrics is not very useful - we want to visualize trends over time.
For this purpose, we need a time-series database that will collect and store the metrics: [Prometheus](https://prometheus.io/).
We could set up our own Prometheus instance (by creating another `Deployment`) and point it to the application.
Luckily, many cloud platforms already have some kind of Prometheus builtin, and so does OpenShift.
The only thing we need to do is create a special `ServiceMonitor` resource that tells Prometheus where to find the service, how often to collect the data etc.
First, we need to add a `label` to the existing `Service`:
```diff
# real-world/templates/service.yaml
metadata:
name: {{ .Release.Name }}
+ labels:
+ app: {{ .Release.Name }}
```
Then, add the following YAML template in the Helm chart as `real-world/templates/servicemonitor.yaml`:
```yaml
apiVersion: monitoring.coreos.com/v1
kind: ServiceMonitor
metadata:
name: {{ .Release.Name }}-metrics
spec:
endpoints:
- path: "/metrics"
interval: 30s
targetPort: 8080
scheme: http
selector:
matchLabels:
app: {{ .Release.Name }}
```
To create this new resource in the cluster, we need to *upgrade* the Helm chart (because we have previously already *installed* it).
```sh
helm upgrade real-world --reuse-values ./real-world
```
Check if the resource has been created in the cluster.
<details>
<summary>Click here to see the solution</summary>
```
oc get servicemonitor real-world -o yaml
```
</details>
---
Finally, restart the `Deployment` so the pods download and use the latest image: `oc rollout restart deployment/real-world`
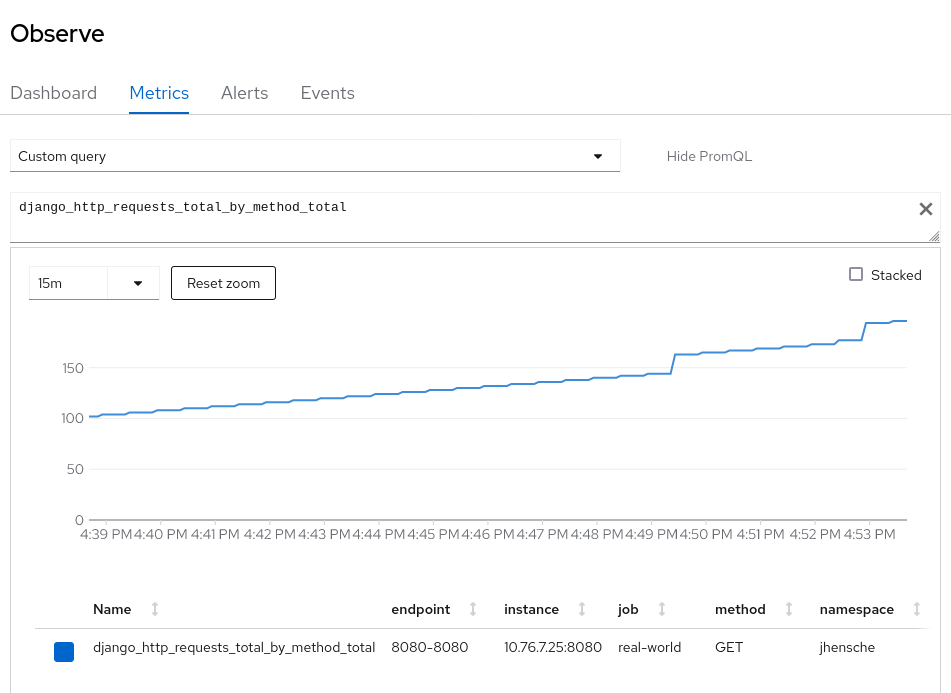
### Go to the OpenShift Web Console to view the metrics
The OKD PaaS platform offers a built-in dashboard for viewing Prometheus metrics.
Go to `https://paas-stg.cern.ch/dev-monitoring/ns/<USERNAME>/metrics` and use the *Custom Query*:
```
django_http_requests_total_by_method_total{}
```
### Perform a load test
We will create a separate deployment that will send HTTP requests to the `real-world` application.
```
oc create deployment load-test --image=registry.cern.ch/docker.io/ddosify/ddosify -- ddosify -t http://real-world:8080 -l waved -d 60 -n 5000
```
In the metrics dashboard, run the following query and observe the changes in the response time:
```
sum by (method,view) (
delta(django_http_requests_latency_seconds_by_view_method_sum{}[20s])
)
```
At the same time, we can also see that the CPU and memory consumption of the "real-world" application have increased drastically:
```
sum by (pod) (node_namespace_pod_container:container_cpu_usage_seconds_total:sum_irate{})
```
```
sum by (pod) (container_memory_working_set_bytes{container!=""})
```
<!-- \pagebreak -->
## 4. Autoscaling the application
To take advantage of the elastic cloud platform, we can set up autoscaling.
The [HorizontalPodAutoscaler](https://docs.openshift.com/container-platform/4.11/nodes/pods/nodes-pods-autoscaling.html) will adjust the number of pod replicas based on the CPU or memory consumption.
Create the resource in the cluster with this command: `oc autoscale deployment/real-world --cpu-percent=60 --min=1 --max=5`
Check if the resource has been created in the cluster and what the YAML manifest looks like.
<details>
<summary>Click here to see the solution</summary>
```
oc get horizontalpodautoscaler/real-world -o yaml
```
</details>
---
Observe the autoscaler in action by monitoring the metrics from before and with these commands:
```
oc get hpa
oc adm top pods
```
## Summary
Congratulations - you have built and deployed a cloud-native application!
Along the way, you learned:
* how container images work and which tools can be used to interact with them;
* how to manually deploy applications on Kubernetes;
* about the different ways in which resources refer to each other;
* how to automatically deploy applications with Helm;
* about metrics monitoring with Prometheus;
* to use metrics for autoscaling applications.
That's a lot!
If you are up for more challenges, you can try to deploy and play with [podinfo](https://github.com/stefanprodan/podinfo) - a web application made with Go that showcases best practices of running microservices in Kubernetes, including end-to-end testing, healthchecks, container image signing and security, tracing and more.