# HGTD: Surface Commissioning
This sheet is intended to list everything needed for the HGTD surface commissioning. Feel free to ==leave comments== so we can discuss and refine the requirements.
## **Questions & Tasks**
- Row and column options during a scan ? pixel choice ?! ==$\rightarrow$ Yes, please==
- Charge injection: *CalPulse* or *ext_disc* ==$\rightarrow$ Both==
- TDC, Trif, TrigN ..need to look for them! ==$\rightarrow$ TDC yes, but replace Trigf and TrigN with Nevents==
- Examples of scans data output: https://cernbox.cern.ch/files/spaces/eos/atlas/atlascerngroupdisk/det-hgtd/altiroc/altiroc3/TIDOctober2023/Data/ts_1696431192?items-per-page=100&view-mode=resource-table&tiles-size=1&sort-by=name&sort-dir=asc
and Plots: https://cernbox.cern.ch/files/spaces/eos/atlas/atlascerngroupdisk/det-hgtd/altiroc/altiroc3/TIDOctober2023/Plots/ts_1696431192?items-per-page=100&view-mode=resource-table&tiles-size=1&sort-by=name&sort-dir=asc
- Vthc config files ? Not yet taken during initialization !! ==$\rightarrow$ It should be included as well==
- Charge step can be a non-integer value -> need to be changed. ==$\rightarrow$ Double-check please==
- LSB calibration == Delay + Width scan! And then when they are set ?
--> https://gitlab.cern.ch/atlas-hgtd/Electronics/FADA/-/blob/master/firmware/FastFADA_ALTIROC3_newFW/scripts/combinedScan.py?ref_type=heads ==$\rightarrow$ Probably at some afterward configurtions step==
- Delay scan in the pixel (of "*active*" time window relative to the clock)
- Since each module need to be characterized independently (may have different optimal thresholds), those info need to be picked from a given file at the initialization once for all !
### A. **Scans**
- [ ] Vth, Vthc, Charge scans $\rightarrow$ 60 % of completion.
- [ ] Delay and Width scans $\rightarrow$ just started to work on them.
- [ ] Determine thresholds for failed tests (lost coomunications or failure): readout benchmark.
- [ ] Databasing of results
- [ ] Noise scan, linearity tests, source scan ? ==$\rightarrow$ Not a priority for the moment~==
We may need to decide which scans are the most relevant for surface commissioning.
### B. **Miscellaneous**
- [ ] **Scaling:** Determine time taken for full suite of tests using a single module, then for a multiple modules to test how the system scales $\rightarrow$ Optimization.
- [x] **DataBase:** Link the software to the HGTD database prototype to be able to read values from previous tests (as starting points for scans) and record test results.
- [ ] **Docs:** Document the usage of the framework for surface commissioning in an internal note. ==$\rightarrow$ Ongoing...==
# I. DAQ software structure
# II. Scans purposes
This section aim to resume what each scan is doing exactly on the hardware level and what is the purpose of each scan.
### A. **Threshold scan** (Vth):
The goal is to set a general threshold value,-> correspond to it will modify registers 965 and 966 on each asics.
different scan parameters, their default values and what they do exactly, what is their purpose !
### B. **Corrected Threshold scan** (Vthc):
### C. **Charge scan**:
### D. **Delay scan**:
a. The function `runDelay` is defined with two parameters: `alti` and `args`. `alti` is likely an object that interacts with an ASIC (Application-Specific Integrated Circuit), and `args` is a set of arguments or options.
b. A nested function `getDelay` is defined, which calculates and returns a delay based on two inputs: `cdelay` and `fdelay`. These are likely coarse and fine delay values. The function also uses constants `ASICConfig.coarseDelayDacToPs` and `ASICConfig.fineDelayDacToPs` to convert the delay values from DAC units to picoseconds.
c. The output directory is set based on the `args.outputDir`, `args.ext_discri`, and `args.suffix` provided. If the directory does not exist, it is created.
d. The ASIC is configured using the `alti` object and the `args` provided. This includes a hardware reset (`alti.por_hard_rst()`), setting the ASIC configuration (`ASICConfig.setting(alti,args)`), setting the trigger period (`alti.set_period_trig(args.periodtrigger)`), and setting the pulser and threshold DAC values if `args.ext_discri` is False.
e. The program then sleeps for 0.2 seconds, reads an ASIC register at address 0x2000, and prints the result.
f. The program attempts to synchronize timing with the ASIC using `alti.sync_timing()`. If successful, it prints a success message. If not, it prints an error message.
g. The program then enters a loop over a range of coarse and fine delay values (`cdelay` and `fdelay`). These ranges are determined by `args.cDelayMin`, `args.cDelayMax`, `args.cDelayStep`, `args.fDelayMin`, `args.fDelayMax`, and `args.fDelayStep`. For each combination of these values:
- It writes the coarse delay value to an ASIC register at address 0x101B.
- It writes the fine delay value to an ASIC register at address 0x101C.
- It runs an acquisition using the `alti` object and saves the data to a file.
- It checks the size of the data file. If the file is not empty, it extracts the data, adds delay information to the data, and prints a message with the delay values and data size. If the file is empty, it prints an error message and sleeps for 0.1 seconds.
h. After looping over all delay values, if a specific pixel was specified in `args.pixelPlot`, it plots the data for that pixel.
i. Finally, it stops the acquisition with `alti.stop_acq()`.
This function seems to be part of a larger program for controlling and interacting with an ASIC. It's running a delay scan, which is a common procedure in hardware testing where different delay values are tested to see how the system performs.
### E. **Width scan**
# III. Scans Sequence
The sequence diagram shown below illustrates the logic flow of a scan operation, depicting the interactions among various components in the system during the scan initialization, scan step, and scan data acquisition phases.
The initialization phase is highlighted in red, the scan step phase in green, and the data acquisition phase in blue. Components such as RunControl, Configurator, and DataHandler are activated and deactivated at different points to denote when they are actively processing commands or data.
### Initialization Phase (SCAN INIT)
In the initialization phase, the `RunControl` component initiates the scan by sending a `SCAN_INIT` command to the `Configurator`, `SerialCommunicator`, and `DataHandler`. The Configurator saves the scan information into private members (m_...) and will be re-used in the coming steps, while the DataHandler saves the scan information and creates text files for data storage. Upon completion, both the Configurator and DataHandler respond to RunControl with `SCAN_INIT_DONE`.
### Scan Step Phase (SCAN STEP)
During the scan step phase, the system enters a loop to process multiple scan steps. The `RunControl` sends a `SCAN_STEP` command to the `Configurator`, `SerialCommunicator`, and `DataHandler`. The Configurator then interacts with the SerialCommunicator to set register values according to the scan parameters (through Felix). After setting the register values, the Configurator responds to RunControl with `SCAN_STEP_DONE`.
### Data Acquisition Phase (SCAN DAQ)
In the data acquisition phase, the `RunControl` sends a `SCAN_DAQ` command to the `Configurator`, `SerialCommunicator`, and `DataHandler`. The DataHandler then saves the acquired data from felix into text files. Upon completion of the data acquisition process, the DataHandler responds to RunControl with `SCAN_DAQ_DONE`.
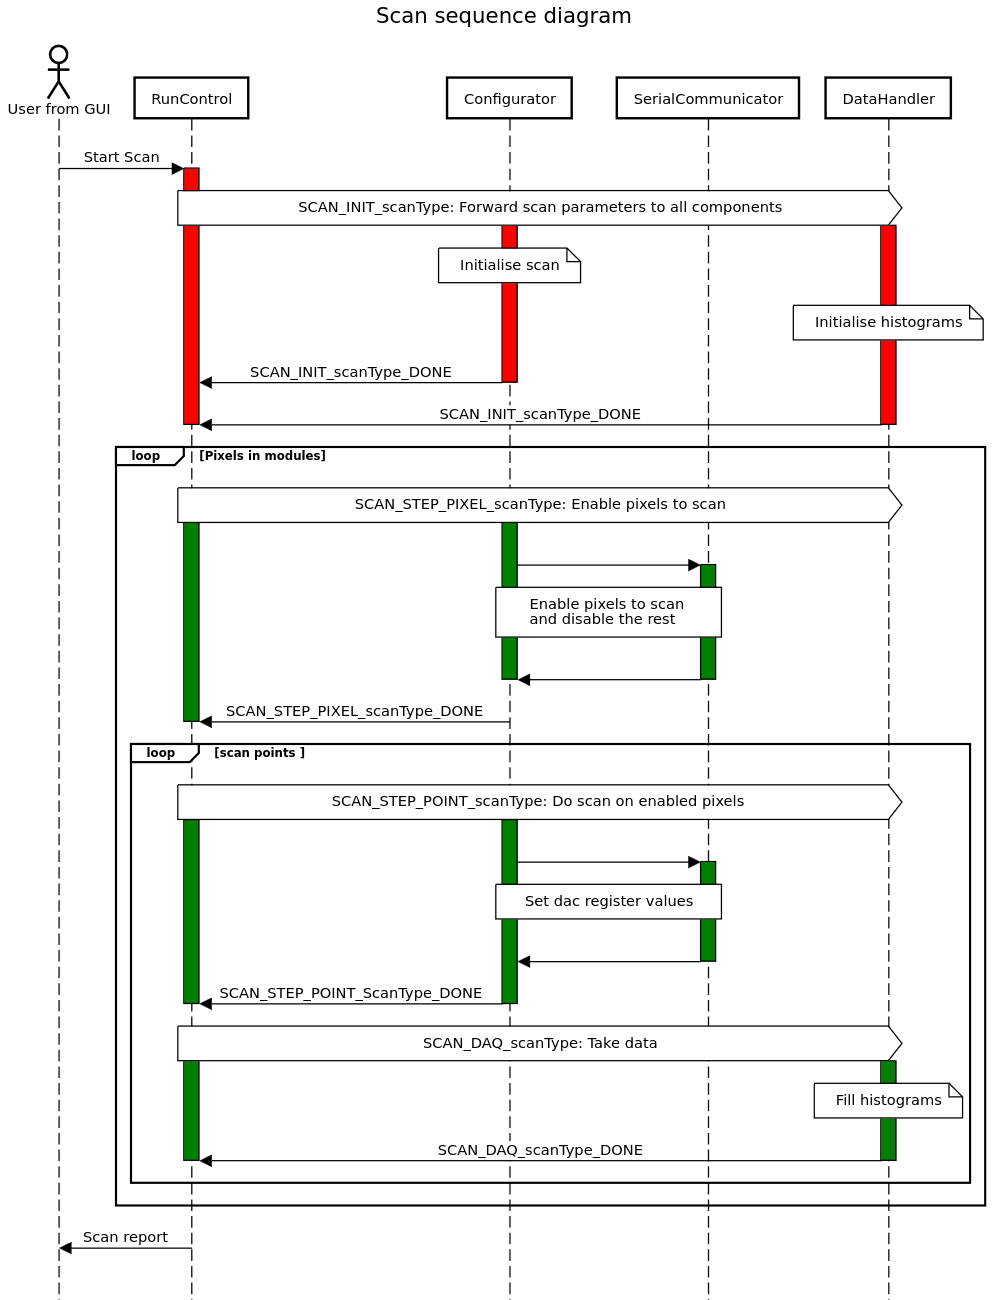
\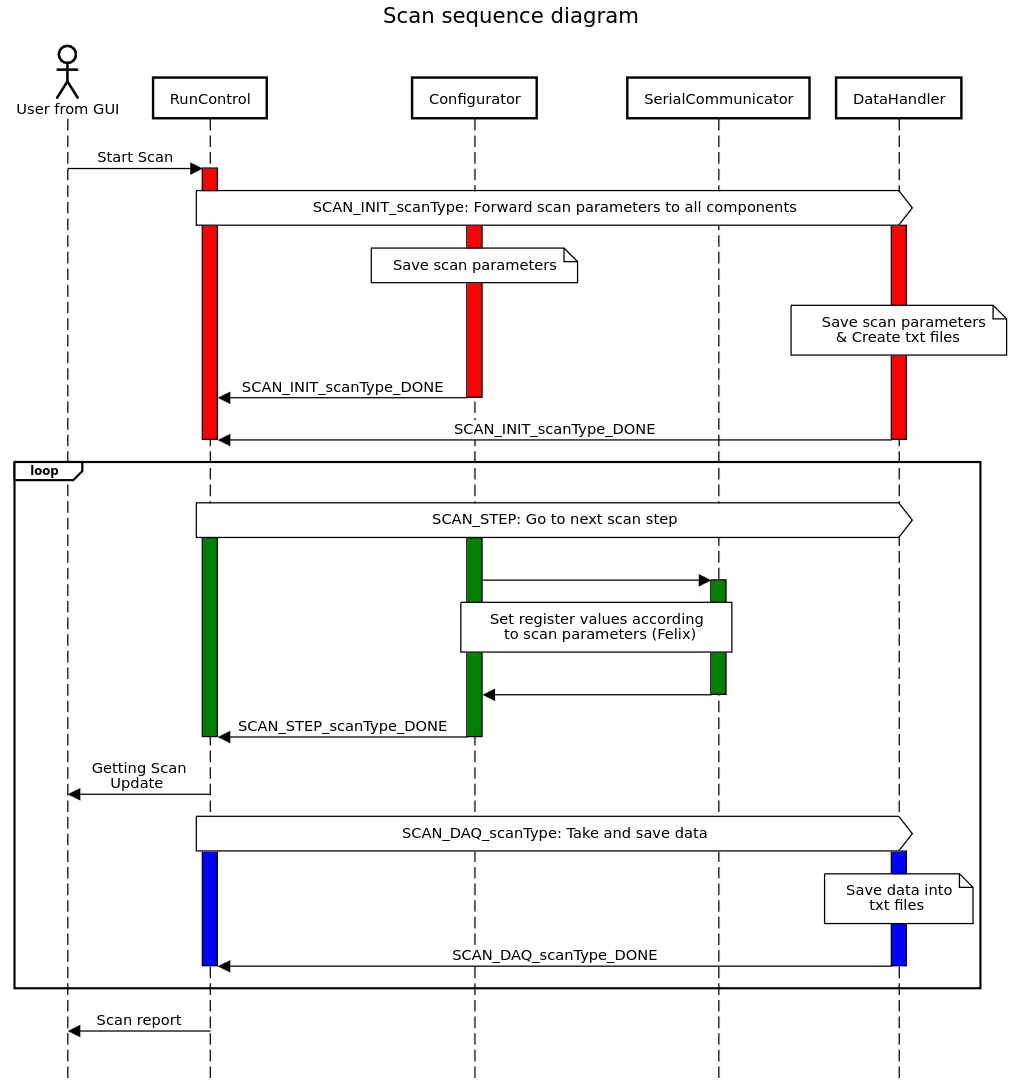 % Previous diagram
# IV. Scans implementation manual
This section aim to be a general guide on how to add a new scan functionality to the `hgtd-felix-sw`. It is organized by changes to be done by repository, from the `start scan` button in the web interface up to the handling of requests in the different compenents of the software. Some commented code snippets are give at each step, and basic definitions as those in header files are skipped.
### A. Monitoring And Control
1. **Create an interface for your scan**:
The first step in to create a section for your scan in the `WebInterface.html` code. From top to bottom, make an option to select the modules to scan from a Json file, specify the parameters for the scan (these values are entered in the input fields in the table), add "Start Scan", "Stop Scan" buttons, as well as the the status bar to monitor the progress of the scan later. The main structure is given below. Make sure to replace all the `ScanName` and so with the approprotiate identifier of your scan.
```html=
<div id="main-content" class="section-content">
<div id="ScanName" class="hidden">
<h2>ScanName</h2>
<p>SOME GENERAL MESSAGE</p>
<div class="center-content">
<table>
<tr>
<!-- Input element for choosing a JSON file and module selection, this section can be coppied from other scans-->
</tr>
<tr>
<td>Arg0:</td>
<td><input type="text" id="Arg0" value="DEFAULT VALUE" /></td>
</tr>
<tr>
<td>Arg1:</td>
<td><input type="number" id="Arg1" value="DEFAULT VALUE" /></td>
</tr>
</table>
<button class="button start-button" id="btn_start" type="button" onclick="startScanName()">Start Scan</button>
<button class="button stop-button" id="btn_stop" type="button" disabled>Stop Scan</button>
</div>
<div class="update-bar">
<div id="progress-bar" class="progress-bar" role="progressbar" aria-valuemin="0" aria-valuemax="100" aria-valuenow="0"></div>
<div id="status-text">Start your scan and follow it's completion here !</div>
</div>
</div>
```
Make a top navigation bar scan button within the `TopNavigationBar.html` file by adding to the file:
```html=
<button class="dropdown-item" onclick="showSelectedContent('ScanName')">ScanName</button>
```
2. **Make your scan communicate the request**
Go to the javascript file `Function.js` to define what the freshly created *start* button do.
```javascript=
function startScanName() {
clearInterval(scanInterval);
//This first part is common to each scan,
//so you can copy what's in the already available scans !
//
// Enable the stop button and change its color
// Disable the start button and change its color
// Get list of selected modules
var Arg1 = document.getElementById("Arg1").value;
//Collect other scan parameters
//Send the HTTP request to start the scan
cmd_str = `CmdFolder/ScanName/cmd.json?arg1=${val1}&...`;
JSROOT.NewHttpRequest(cmd_str, "object").send();
//Set the status bar update
updateScanStatusBar();
scanInterval = setInterval(updateScanStatusBar, 100);
}
```
```javascript=
window.startScanName = startScanName; //Add it at the bottom of the code with the others
```
3. **Register your scan into the server**:
To add a new scan to the web interface server, begin by registering the new command within the HTTP server in the `WebInterfaceServer.cxx` file as follows:
```cpp=
m_http_server->RegisterCommand("/CmdFolder/ScanName",
"/WebInterfaceServer/->ScanName(\"%arg0%\", %arg1%, ...)");
```
Next in the `WebInterfaceServer.h` file, add a method declaration for the new scan such as:
```cpp=
void ScanName(const std::string& Arg0, int Arg1, ...) {
m_scanname(Arg0, Arg1, ...);
}
void setScanName(
std::function<void(const std::string&, int, ...)> f) {
m_scanname = std::forward<std::function<void(const std::string&, int, ...)>>(f);
}
```
Finally, open the `WebInterface.cxx` file and define in it:
```cpp=
m_webserver.setScanName(
[this](const std::string& Arg0, int Arg1, ...) -> void {
return this->runScanName(Arg0, Arg1, ...);
});
```
4. **Define the new scan method**:
Create a new method similar to `runVthScan` in the `WebInterface.cxx` file. This method should take the necessary parameters for your scan and build a JSON command to initiate the scan. The JSON command should include the scan type, the command type (which should be `SCAN_INIT` to start the scan), and any other parameters needed for the scan. Remember to replace `runScanName` and `YourScanType` with the actual method name and scan type for your scan. Also, replace "/* scan parameters */" with the actual parameters needed for your scan.
```cpp=
void WebInterface::runScanName(/* scan parameters */) {
// Update the scan status-bar
m_scan_json["completion"] = 0;
m_string_carrier->SetTitle(m_scan_json.dump().c_str());
// Build the scan command
nlohmann::json myscancmd;
myscancmd["scan_type"] = "YourScanType";
m_currentScan = myscancmd["scan_type"];
myscancmd["cmd_type"] = "SCAN_INIT";
myscancmd["name"] = name;
// Add other parameters to the command
// Send the command
DataMessage<hgtd::DataMsgType> msg;
msg.m_header.m_message_type = hgtd::DataMsgType::SCAN_CMD;
msg << myscancmd.dump();
sendMessageToAll(msg);
}
```
**REMARK: There is no need to modify the OnMessage method on the WebInterface side :+1:**
### B. Configurator & Data Handler
In both the Configurator and the DataHandler, the struture of handling the scan requests from the RunControl are quite similar (their OnMessage method).
It is divided into three parts that are shared between all the scans, i.e. `SCAN_INIT`, `SCAN_STEP` and `SCAN_DAQ`. All you need to do is to add a sub-sub-section `else if` condition on the `scan_type` to handle what is specific to your scan. A remark on the SerialCommunicator is that it receives those different messages without doing anythink to them, it receives instruction from the Configurator on which should registers should be written. Make sur to replace `YourScanType` with a keyword corresponding to your scan. The replies back to to RunControl are common to all scans and is already implemented.
Here I decided to skip what is related to methods related to Altirocs (i.e. what should be add in the sub-sub-sections defined above), they will be detailed in another section.
```cpp=
if (scan_cmd["cmd_type"] == "SCAN_INIT") {
//Handling of the request based on the scan_type
} else if (scan_cmd["cmd_type"] == "SCAN_STEP") {
//Same..
} else if (scan_cmd["cmd_type"] == "SCAN_DAQ") {
//Same..
}
```
# IV. DataBase setup
Few additional steps are required to make the database accessible from our WebInterface. The following instructions are specified for an AlmaLinux 9 opearting system with the Oracle database.
Complementary informations can be found on the [HGTD Database Documentation](https://hgtd-database.docs.cern.ch/).
1. **Install Node.js**
First of all, install Node.js. You can either use the NodeSource repository for the latest version or the version provided by AlmaLinux's package manager.
```bash
sudo dnf install -y nodejs
```
Verify the installation (For me it is v16.20.2):
```bash
node -v
```
2. **Install Oracle Instant Client**
To connect to an Oracle database, you need to install the Oracle Instant Client. Visit the [Oracle Instant Client download page](https://www.oracle.com/database/technologies/instant-client/downloads.html) and download the relevant RPMs for your operating system.
Typically for an AlmaLinux 9 on a standard x86_64 architecture, you should be looking for the Instant Client packages for x86_64, not ARM. I have been working with [Instant Client for Linux x86-64 version 19.19.0.0.0](https://www.oracle.com/database/technologies/instant-client/linux-x86-64-downloads.html). You'll need the following RPMs:
- Basic Package: `wget https://download.oracle.com/otn_software/linux/instantclient/1919000/oracle-instantclient19.19-basic-19.19.0.0.0-1.el9.x86_64.rpm`
- SQL*Plus Package: `wget https://download.oracle.com/otn_software/linux/instantclient/1919000/oracle-instantclient19.19-sqlplus-19.19.0.0.0-1.el9.x86_64.rpm`
Once downloaded, install the packages using the `dnf` command:
```bash
sudo dnf install oracle-instantclient19.19-basic-19.19.0.0.0-1.el9.x86_64.rpm
sudo dnf install oracle-instantclient19.19-sqlplus-19.19.0.0.0-1.el9.x86_64.rpm
```
3. **Configure your oracle database**
Now we can configure your Oracle client. We need a `tnsnames.ora` file in order to connect database from SQL Developer. Go to ```~/Oracle/network/admin``` and create the file `tnsnames.ora` with the following content:
```ba
int8r_tunnel=(
DESCRIPTION=
(ADDRESS= (PROTOCOL=TCP) (HOST=localhost) (PORT=10004) )
(LOAD_BALANCE=off)
(CONNECT_DATA=
(SERVER=DEDICATED)
(SERVICE_NAME=int8r.cern.ch)
(FAILOVER_MODE=
(TYPE=SELECT)
(METHOD=BASIC)
)
)
)
int8r=(
DESCRIPTION=
(ADDRESS= (PROTOCOL=TCP) (HOST=int8r-s.cern.ch) (PORT=10121) )
(LOAD_BALANCE=on)
(ENABLE=BROKEN)
(CONNECT_DATA=
(SERVER=DEDICATED)
(SERVICE_NAME=int8r.cern.ch)
)
)
```
export the necessary paths of node, Oracel and TNS in you `.bashrc` file as follows:
```bash=
export NODE_PATH="~/hgtd-felix-sw/MonitoringAndControl/data/WebInterface/node_modules"
export ORACLE_HOME="~/Oracle"
export TNS_ADMIN="~/Oracle/network/admin"
```
4. **Set Up SSH Tunneling**
You need to create an SSH tunnel to securely connect to the Oracle database at CERN. Open your `.bashrc` and add to it the following alias. Make sure to replace `username` with your CERN username and to keep this terminal and tunnel open while using the database.
```bash
alias tunnel_int8r='ssh username@lxplus.cern.ch -L 10004:itrac1601-v.cern.ch:10121 -L 10005:itrac1609-v.cern.ch:10121'
```
5. **Install Required Node.js Packages**
Install the necessary node packages:
```bash
npm install express oracledb cors dotenv
```
6. **Create the `.env` File**
In your project directory (i.e. MonitoringAndControl/data/WebInterface/), create a `.env` file to store your database credentials (Ask DB people to provide them for you).
```script=
DB_USER=your_username
DB_PASSWORD=your_password
```
7. **Run the Node.js Server**
Ensure your SSH tunnel is active and start the server. In the meantime, you can a look at the `DBserver.js` script to see the available end-points (app.get(...)) and add others if needed.
```bash
node dbServer.js
```
8. **Make use of the database**
It goes on three steps, each on a separate terminal and a web browser:
- **Create your ssh tunnel (step 3)**: `tunnel_int8r`
- **Run the DB server (step 8)**: `node DBserver.js`
- **Run our software**: `Executables/exe/run_executables.sh /CONFIG/` by replacing /CONFIG/ by for example: /LPC/
- **Open the WebInterface in a browser**:`http://localhost:PORT` while `PORT` is to be replaced by the port number in your chosen `CONFIG` file. For `/LPC/` it is `44426`.
Complementary informations on the database can be found here in the [hgtd-database.docs](https://hgtd-database.docs.cern.ch/database/#connection-from-outside-cern-network).
# V. Temperature measurement
Temperature measurement inside Altiroc3 involves reading analog voltages from temperature sensors (sensor_temp1 and sensor_temp2) using a monitoring probe and converting the voltage into a temperature value using the internal ADC (Analog-to-Digital Converter) of Altiroc or the external ADC embedded inside the lpGBT. **Because of its limited precision, the internal ADC can be used only for debeug purpose.**
First of all, Altiroc3 have two temperature Sensors: sensor_temp1 and sensor_temp2. They output a voltage that corresponds to the temperature in a given range.
- For sensor_temp1:
Dynamic range: -40°C to +40°C.
Sensitivity: about 0.2°C/mV.
- For sensor_temp2:
Dynamic range: -40°C to +40°C.
Sensitivity: about 0.5°C/mV.
The temperature sensors output a voltage proportional to the temperature, which you need to read via the monitoring system. This voltage can be fed into the ADC for conversion into a digital value.
Note: There are indeed two temperature sensors in Altiroc3, but only temp1 can be converted by the ADC (see table 29 in datasheet).
### ADC Conversion
The internal ADC is responsible for converting the analog voltage from the temperature sensors (or from any other voltage selected at the monitoring_probe - register #1015) into a 10-bit digital value that can be processed. The result of this conversion is stored in two separate registers:
- **CONF_ADC0** (address `0x2022`) stores the lower 8 bits (LSB) of the ADC conversion result.
- **CONF_ADC1** (address `0x2023`) stores the upper 2 bits (MSB) of the result.
Together, these two registers provide the full 10-bit digital output corresponding to the analog voltage from the temperature sensor `sensor_temp1`.
The operation of the ADC is controlled by the **CONF_ADC_CTRL** register (address `2021`), which consists of two control bits:
- **ENABLE_CLK [0]**: Controls whether the clock for the ADC control logic is enabled.
- `0`: ADC control logic clock disabled.
- `1`: ADC control logic clock enabled.
- **SEL_SLOW_CLK [1]**: Selects the clock speed for the ADC control logic.
- `0`: Use the 10 MHz clock for ADC control.
- `1`: Use the 5 MHz clock for ADC control.
Default value: 0b00 (ADC clock disabled and 10 MHz clock selected).
### Monitoring Probe Configuration
The **monitoring probe** allows the selection and monitoring of one of the internal voltages within the system. His configuration is managed through the **CONF_SEL_PROBE_MONITOR** register (address `1015`), which consists of three key fields:
- **ADDRESS [4:0]**: This 5-bit field selects one of the 32 internal bias voltages to be monitored. The value you set here determines which voltage source will be probed.
- **ENABLE [5]**: This bit enables or disables the monitoring probe.
- `0`: Probe monitoring is disabled.
- `1`: Probe monitoring is enabled.
- **OTA_ENABLE [6]**: This bit controls the **On-The-Air (OTA)** mode for the probe.
- `0`: OTA for the monitoring probe is disabled.
- `1`: OTA for the monitoring probe is enabled.
By default, this register is set to `0b0000000`, meaning that the probe monitoring and OTA are disabled, and no specific voltage is selected for monitoring.
Once the monitoring probe is configured, the voltage corresponding to the selected internal bias can be output through the probe and converted by the internal ADC for further processing.
### Example usage:
If you want to probe the **sensor_temp1** at 10MHz, you will need to:
**1. Set the the registers appropriately:**
- Set **CONF_SEL_PROBE_MONITOR (`0x1015`) to 0b11010001**
- **ADDRESS [4:0]**: Set the appropriate value to select **sensor_temp1** (check the specific address for sensor_temp1 in the documentation).
- **ENABLE [5]**: Set this bit to `1` to enable probe monitoring.
- **OTA_ENABLE [6]**: Set this bit to `1` to enable OTA mode.
- Set **CONF_ADC_CTRL** (`0x2021`) to 0b00000001**
- **ENABLE_CLK [0]**: Set this bit to `1` to enable the ADC control logic clock.
- **SEL_SLOW_CLK [1]**: Depending on the desired clock speed, set it to `1` by default.
2. **Extract the 10-bit ADC value**:
Once configured, you can get the ADC value by reading the **CONF_ADC0** for the LSB and **CONF_ADC1** for the MSB. To get the full 10-bit ADC value, you need to combine these two registers:
```
ADC_value = (CONF_ADC1 << 8) | CONF_ADC0
```
This shifts the MSB (from `CONF_ADC1`) by 8 bits to the left and combines it with the LSB (from `CONF_ADC0`).
3. **Convert the ADC value to voltage**:
- The ADC typically converts the input voltage into a digital value based on its resolution and reference voltage.
- Assuming a **reference voltage (Vref)**, the formula to convert the ADC value to the corresponding voltage is:
```
Voltage (V) = (ADC_value / 1023) * Vref
```
- Here, `1023` represents the maximum value of the 10-bit ADC (which ranges from 0 to 1023), and `Vref` is the reference voltage used by the ADC, which needs to be provided or known. In Altiroc, Vref is provided by the BandGap block; the nominal value is 1.0V.
- Example
With a reference voltage of **1.0V**, and you read the following:
- `CONF_ADC0 = 0x5A` (90 in decimal)
- `CONF_ADC1 = 0x02` (2 in decimal)
Then:
```
ADC_value = (2 << 8) | 90 = (512) | 90 = 602
Voltage (V) = (602 / 1023) * 1.0 = 0.588 V
```
This voltage value can now be used to calculate the temperature based on the sensor sensitivity.
4. **Get the temperature**
Now that you have the voltage from the ADC, you can calculate the temperature using the **sensitivity** of the temperature sensor. From the information provided for **sensor_temp1**, the sensitivity has been evaluated by measurement to **0.18°C/mV** (or **180°C/V**) but may vary a bit from chip to chip.
### Formula to convert voltage to temperature:
Temperature (°C) = (Voltage (V) / Sensitivity (°C/V)) + T_offset
Where:
- **Voltage (V)** is the value you calculated from the ADC.
- **Sensitivity** for sensor_temp1 is **180°C/V** (since 0.18°C/mV).
- **Vtemp0** is the voltage given by the temperature sensor corresponding to 0°C. This voltage has been evaluated to 632mV **but varies significantly from chip to chip** (it is still in evaluation). You might need to check the exact offset by calibration using an external reference temperature sensor.
### Example calculation:
If you have measured the **Voltage** as **0.706V**:
Temperature (°C) = [(0.706 - 0.632) V] * 180°C/V
So, the temperature would be approximately **13.3°C** for that voltage reading.
# VI. Useful links
- Altiroc3: https://cernbox.cern.ch/files/link/public/GoUJyGwHSVlJmNM?tiles-size=1&items-per-page=100&view-mode=resource-table