# Grafana Annotations
MONIT team - 16.11.2020
---
## Annotations Use Cases
* Annotate documents
* Add "classification" tags to individual documents
* Usually done with some processing infrastructure
* Not directly supported by Grafana
* Annotate time-series
* Add comments/data to time-series / plots
* Can be done **manually** or **programatically**
* Supportted by Grafana
:::danger
These following slides are about time-series annotations
:::
---
## Grafana Annotations
* Provide a way to mark points on the graph with rich events
* Built-in feature of Grafana since v4.6
* Can be a single point annotation or a time interval
* Can have multiple scopes: global, dashboard, plot
* Can be enriched with any tags
* Are stored in Grafana internal database (mysql)
---
## Add Annotations
* On Grafana
* Done by holding down Ctrl/Cmd + Click over a graph
* Complete documentation in the Grafana [docs](https://grafana.com/docs/grafana/latest/dashboards/annotations/)
* Annotations can be enriched with tags
* Automatic addition of template variables as tags
* Added as patch by the Cloud team ([slides](https://indico.cern.ch/event/966906/contributions/4075333/attachments/2134886/3595876/Grafana%20Annotations%20for%20Cloud%20Anomaly%20Detection%20Project%20-%20OPINT.pdf))
* Being discussed upstream ([github](https://github.com/grafana/grafana/issues/24674))
* Please comment to make this move fwd!
---
## Add Annotations
* Programatically
* Done using the Grafana Annotations HTTP API
* Complete documentation in the Grafana [docs](https://grafana.com/docs/grafana/latest/http_api/annotations/)
* Being used today by CMS [slides](https://indico.cern.ch/event/966906/contributions/4075334/attachments/2134817/3595863/OpInt%20021120%20-%20Grafana%20annotations%20in%20CMS%281%29.pdf)
```json=
POST /api/annotations HTTP/1.1
{
"dashboardId":468,
"panelId":1,
"time":1507037197339,
"timeEnd":1507180805056,
"tags":["tag1","tag2"],
"text":"Annotation Description"
}
```
---
## Access Annotations
* Only visible in the graph panel today
* Support for the new table panel is coming
---
## Access Annotations
* On Grafana: internal annotations
* Annotations that are stored in the internal database
* added as explained in previous slides
* Visibile due to the built in annotation query
* exists by default on all dashboards
* fetch all annotation that come from the dashboard
* show them on the panel where they were created
* Other annotation query can be added
---
## Access Annotations
* On Grafana: other datasets
* Annotations are fetched via annotation queries
* Using data from any other data source
* The annotation query are different for each data source:
* Elasticsearch annotation queries
* InfluxDB annotation queries
* Prometheus annotation queries
* MySQL annotation queries
* Loki annotation queries
---
## Access Annotations
* Programatically
* Done using the Grafana Annotations HTTP API
* Complete documentation in the Grafana [docs](https://grafana.com/docs/grafana/latest/http_api/annotations/)
```json=
GET /api/annotations?from=1506676478816&to=1507281278816&tags=tag1&tags=tag2&limit=100 HTTP/1.1
Accept: application/json
Content-Type: application/json
Authorization: Basic YWRtaW46YWRtaW4=
```
---
## MONIT Annotation Example
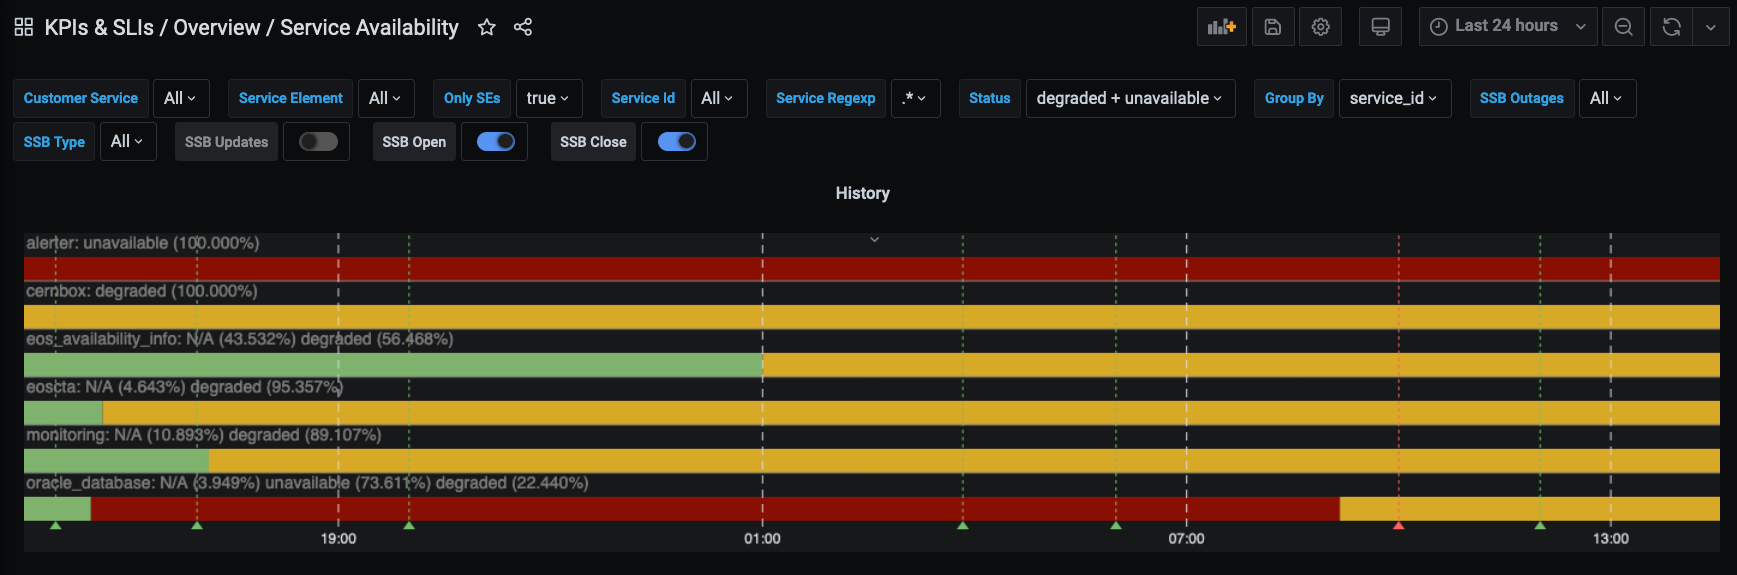
* We have integrated ServiceNOW SSB entries
* Stored in dedicated database (data source)
* Using this data in the Service Availability dashboard
---
## How can MONIT Help ?
* Integrate **common datasets** to be used as annotations
* Follow upstream tickets
* Tags from template variables
* Show annotations in table
* Support Org Admins adding or using annotations
* Please create SNOW tickets
---
## Thank You
http://cern.ch/monit-support
---