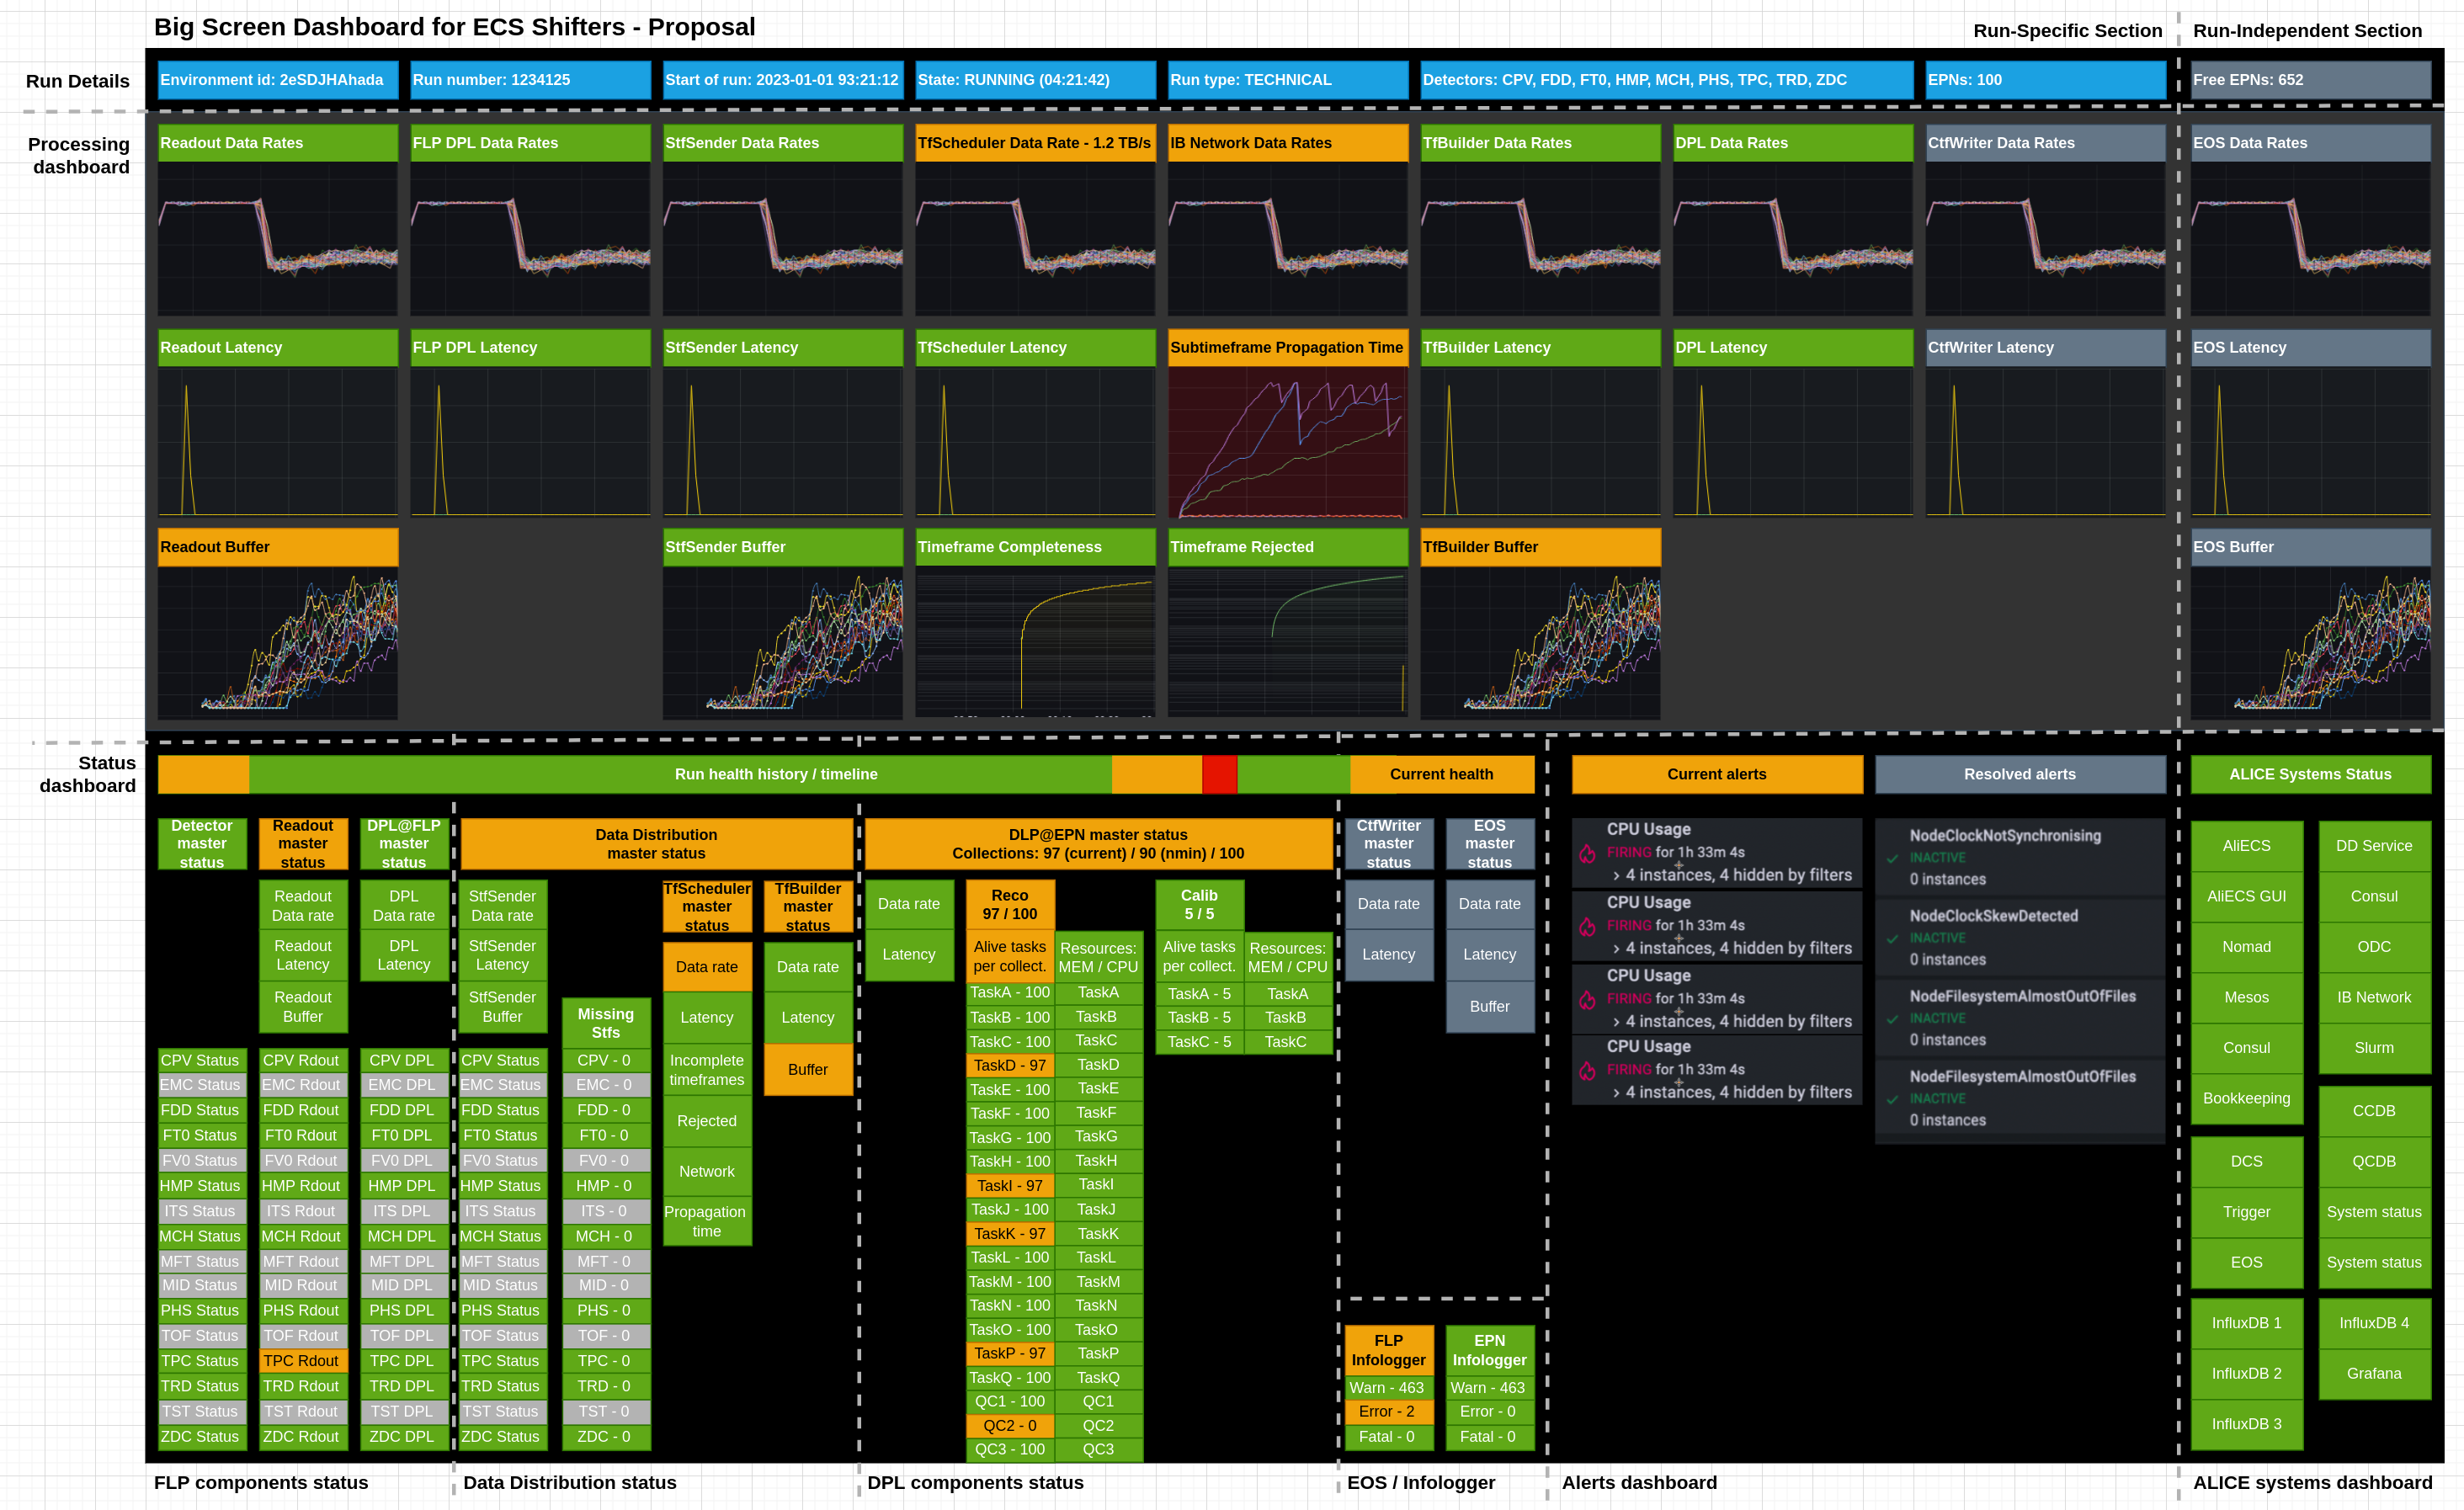
# Monitoring Big Screen Dashboard
[https://grafana.com/blog/2022/06/06/grafana-dashboards-a-complete-guide-to-all-the-different-types-you-can-build/](https://grafana.com/blog/2022/06/06/grafana-dashboards-a-complete-guide-to-all-the-different-types-you-can-build/)
[https://grafana.com/docs/grafana/latest/panels-visualizations/visualizations/state-timeline/?pg=blog&plcmt=body-txt](https://grafana.com/docs/grafana/latest/panels-visualizations/visualizations/state-timeline/?pg=blog&plcmt=body-txt)
[https://grafana.com/docs/grafana/latest/panels-visualizations/visualizations/stat/?pg=blog&plcmt=body-txt](https://grafana.com/docs/grafana/latest/panels-visualizations/visualizations/stat/?pg=blog&plcmt=body-txt)
# Mockup
# Sample docs
https://alice-epn.docs.cern.ch/monitoring/TF-scheduling.html
https://alice-epn.docs.cern.ch/monitoring/TF-completeness.html
https://alice-epn.docs.cern.ch/monitoring/TF-buf-util-per-EPN.html
# Open points
Any other input from https://alice.its.cern.ch/jira/browse/OMON-666?
https://alice.its.cern.ch/jira/browse/EPN-140
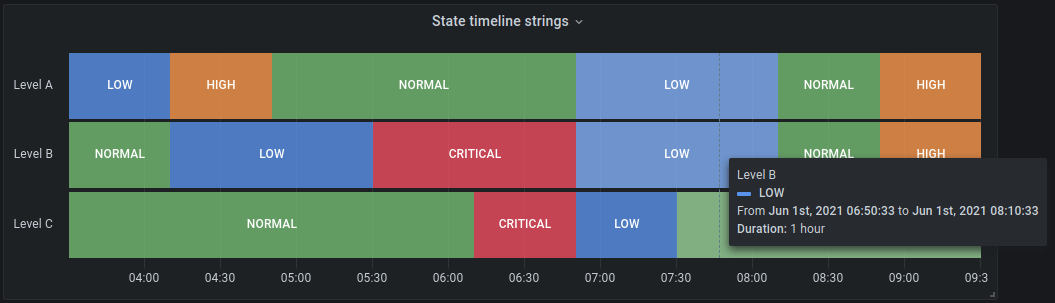
### Sticky status
It would be good to give some simple tools for the shifters to clear the status indicators.
* If we cannot make the status indicators sticky (meaning they would reset after the aggregation period), we can use the status timeline:
### Alice Top Level Metrics
- [ ] Distinction between a per-run dashboard and global dashboard (EOS part for example)
### Data Flow Metrics
All data flow metrics are to be configurable per run type.
The data flow part of the dashboard shows the **current** state of processing.
- [ ] How granular configuration do we want? There are still way too many free parameters that determine the performance even when the same run type is used.
### Other ideas
- [ ] Dedicated section per detectors
- Dataflow
- CRU / Readout status
- FLP Workflow errors
- StfSender DD errors
- EPN processing
- QC processing
## Dedicated debug from Giulio
## Data flow visualisation
- [x] Would it make sense to also have per-node visualisation or just per-detector, collection?
- We decided on less granular per detector
| FLP | DD | EPN | EOS |
| --- | --- | --- | --- |
| ITS (30 GB/s) | Completeness (100%) | Reconstruction (125/115/125) | |
| TPC (650 GB/s) | Rejected (0%) | Calibration (125//115/125) | |
| TOF (30 GB/s) | | Nodes (125/115/125) | |
| ZDC (30 GB/s) | Network utilization (75%) | | |
| TRD (10 GB/s) | | | |
| Data rate (2610 GB/s) | Data rate (750 GB/s) | Data rate (185 GB/s) | Data rate (143 GB/s) |
| Freshness (351ms) | Freshness (1.2s) | Freshness (1m34s) | Freshness (13m) |
| Buffer StfSender (12%) | | Buffer TfBuilder (75%) | Buffer /data (75%) |
## Data freshness / latency
- [ ] Do we want to measure freshness (from the collection time of the data = cumulative) or latency (from the time the data has arrived to the components)?
- Watermark on FLPs, timestamp of subtime frame / timeframe vs finished processing on FLPs, max overall FLPs in a run
- Status indicator:
- ≤ 0.5 second
- > 0.5 second
- > 1 second
- Watermark on EPNs, timestamp of subtime frame / timeframe vs finished processing on EPNs, max over all EPNs
- Status indicator:
- ≤ 30 seconds
- > 30 seconds
- > 2 minutes
- No EPNs in the run
- Watermark on EOS, async - unrelated to a run
- Status indicator:
- ≤ 5 minutes
- > 5 minutes
- > 24 hours
- No EOS storage is enabled in the run
## Buffer space
It probably only makes sense to measure this on components that actually provide a buffer
- FLP outgoing buffer (StfSender)
- Status indicator:
- ≤ 10 %
- > 10 %
- > 50 %
- No DD in the run
- EPN incoming buffer (TfBuilder)
- Status indicator:
- ≤ 10 %
- > 10 %
- > 50 %
- No EPNs in the run
- EPN outgoing buffer (/data for epn2eos)
- Status indicator:
- ≤ 5 minutes
- > 5 minutes
- > 24 hours
- No EOS storage is enabled in the run
## Processing
- Configuration loaded: PHYSICS PP500MHz
- Timeframes processed this run: 218 381
- Timeframes processed per second: 80
- Expected / configured timeframe rates
- Running duration: 16:02
- FLPs active
- Status indicator
- > 50 %
- > 90 %
- > 95 %
- No EPNs in the run
- DDS tasks active
- = 100%
- < 100 %
- No EPNs in the run
- DDS collections active
- Currently, NMIN does not consider collections in RUNNING state
- = 100 %
- < 100 %
- < NMIN / N
- No EPNs in the run
- EPNs active
- Currently, NMIN does not consider nodes in RUNNING state
- = N
- < N
- < NMIN
- No EPNs in the run
## Resources
- FLP resource utilization?
- EPN resource utilization, max over CPU and GPU utilization
- Status indicator:
- ≤ 50 %
- > 50 %
- > 90 %
- > 95 %
- No EPNs in the run
The following only status
- EPN CPU resource utilization
- EPN GPU resource utilization
- Status indicator - max of CPU and GPU utilization
- ≤ 70 %
- > 70 %
- > 90 %
- > 95 %
- No EPNs in the run
- EOS resource utilization - we can import several metrics from EOS
## Error handling
### Comment Ole:
Counters for messages of different severity cannot really indicate the processing state. But for any fatal we should get a crashed process -> less DDS active tasks and if a node stops processing this would give one less DDS collection active.
Unless we want to get rid of the InfoLogger for the shifters completely in the future I would not show this information in Grafana as well.
- Number of warnings in both Infologgers
- Number of errors in both Infologgers
- Number of fatals in both Infologgers
- Status indicator for all errors:
- = 0
- > 0 errors AND 0 fatals
- > 0 fatals
- Number of errors from other sources, such as OOM from EPNs
## Log patterns
This is where we should have some pattern recognition from elasticsearch (from ELK stack).
Ole: in which logs do you want to have pattern recognition?
# Data Distribution Status
## Components
- StfSenders state
- Status indicator
- All OK
- Some dead
- Consul
- Status indicator
- OK
- Dead
- TfScheduler
- Status indicator
- OK
- Dead
- No DD in the run (but it still works in DISCARD mode)
- InfluxDB (global)
- Status indicator
- OK
- Dead
- InfluxDB (global)
- Status indicator
- OK
- Dead
- TfScheduler node
- Network switches status
## Timeframe Scheduling
- Incomplete timeframes
- Status indicator
- = 0%
- \> 0 %
- \> 10 %
- No DD in the run (but it still works in DISCARD mode)
- Rejected timeframes
- Status indicator
- = 0%
- \>0 %
- =100%
- No DD in the run (but it still works in DISCARD mode)
- EPN buffer status
- Status indicator
- = 0%
- \> 0 %
- \> 10 %
- No DD in the run (but it still works in DISCARD mode)
## TfBuilder
- Timeframe rates per EPN
- Indicate if some EPNs are outside of the expected range based on the configured rates
- Indicate outliers
- Timeframes loaded to EPN + total
- Timeframes in flight per EPN (maybe?)
- Timeframes finished processing on EPN + total
# DPL
## DPL configuration + rates
- number of tasks per reconstruction collection
- number of calibration collections (currently 9 at max, usually 5) and number of tasks within each
- for rates I am not sure what to put
## DPL errors and task
In principle a matrix would be good. We have X tasks running on N nodes. So for each task in error we should count on how many nodes it is in error to quickly identify misbehaving tasks or nodes.
## DPL other metrics
Possibly just add the current DPL grafana page with memory and CPU usage and TF rate per task for each node?
## CTF Writer
I need to check back with other experts on how to get expected rates depending on the configuration and the rates from readout. E.g. if readout is much too high then probably a detector is noisy. If readout is stable, but CTF size is larger than expected, possibly the compression does not work as expected.
# EOS
## EOS Daemon
- Timeframes on the EPNs + size
- Indicate when exceeds threshold
- Active even when no EOS writing is in the run, this would be a global metrics
- Throughput to EOS
- Only when there are timeframes on the EPN
- Stale timeframes
- WARNING: If a timeframe exists that is 4 hours old
- ERROR: If a timeframe exists that is 24 hours old
# Indication of services UP
Similar to what is in ECS, but visible to the shifters